

Magnitude and characteristics of young driver crashes
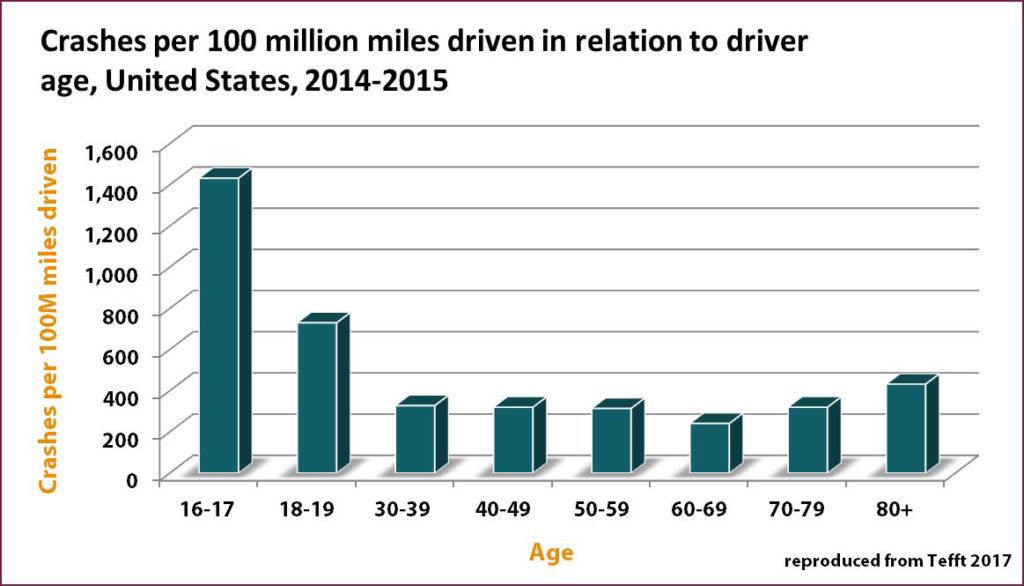
Crash risk. A wealth of research has demonstrated that novice drivers, particularly young drivers, have a higher risk of collision than older and more experienced drivers. The crash risk of young drivers is especially elevated during the first six months of licensure.1 The age groups with the highest crash risk are drivers age 16 to 17 and then those age 18 to 19. Moreover, the crash rate of drivers age 16 to 17 was nearly double that of drivers age 18 to 19 and approximately 4.5 times that of drivers age 30 to 39, 40 to 49, and 50 to 59.2 In other words, there is a crash rate of 1,432 per 100 million miles travelled for 16 to 17 year old, compared to a rate of 730 for drivers age 18 to 19, and 314-328 for those age 30 to 39, 40 to 49 and 50 to 59.2
Crash type. In 2016, 9% of all drivers involved in a fatal motor vehicle crashes (MVCs) were young drivers aged 15 to 20 years,3 and MVCs were the primary cause of death among young Americans4. In particular, young drivers were more likely to experience a single-vehicle crash versus a multiple-vehicle crash; young drivers accounted for 10.6 % of drivers involved in single-vehicle fatal crashes, compared to 7.9 % of multiple-vehicle fatal crashes.3
Sex. An examination of fatal crash involvement by sex revealed that young male drivers were 2.3 times more likely to be involved in a fatal crash in comparison to young female drivers.3 In general, males of all ages are consistently over-represented in fatal vehicle collisions, and account for an average of 70%, whereas females typically account for, on average, 30%.
Risk factors. Young drivers have an elevated crash risk not only because they are inexperienced at driving but also because of their youthfulness. Certain biological, mental and developmental changes during adolescence contribute to teenagers having a disproportionate crash rate. Risk factors include:
- difficulties in the control of behavior and emotion;
- increased impulsivity; and,
- peer influence and independence from parental supervision can increase the likelihood of reckless driving.
Young driver crashes are most often characterized by speeding, distraction, fatigue and impairment.4
- Speeding. Teenagers are over-represented in speed-related crashes, and may be more likely to speed due to the media’s positive impressions of this behaviour, or in efforts to impress their peers in the vehicle
- Distraction. Teenagers are over-represented in distracted driving-related crashes. Internal (e.g., passengers, radio, cell phone, texting) and external (e.g., pedestrians, outside traffic, animals) distractions contribute to this problem, and inexperienced drivers are less able to handle such distractions. The presence of passengers is the most common source of distraction for young drivers, and having teenage passengers in the vehicle of a young driver is known to increase fatal crash risk. In comparison to driving alone, fatal crash risk per mile travelled is quadrupled for drivers age 16 to 17, when three or more teenage passengers were in the vehicle and no adult passengers were present. Even when there is only one teenage passenger present and no adults in the vehicle, young drivers still have an increased crash risk of 44%.5
- Fatigue. Teenage drivers are more likely to drive fatigued and represent one of the highest proportions of fatigue-related crashes in comparison to all licensed drivers. They often do not get enough sleep because of lifestyle (i.e., late hours due to studying, working or socializing) and biological changes (i.e., higher sleep needs, later natural sleep times, and irregular sleep patterns).
- Impairment. Teenagers who drive after drinking have a substantially higher crash risk than drivers of any other age group. When comparing drivers with the same blood alcohol concentration, young drivers are more likely than adult drivers to be involved in a crash.6 Furthermore, those age 15 to 25 year olds are most likely to use drugs, compared to all other age groups. Teen perceptions of drug use while driving indicate that they hold permissive attitudes towards drug use while driving.7 8 9
1Mayhew and Simpson 1990; Simpson and Mayhew 1991; Mayhew and Simpson 1995; Williams 2003; McCartt et al. 2003; Mayhew et al. 2004; Helman et al. 2010; Curry et al. 2017
2IIHS 2017; Mayhew et al. 2005; Tefft 2017
3National Center for Statistics and Analysis. (2018, February). Young drivers: 2016 data. (Traffic Safety Facts. Report No. DOT HS 812 498). Washington, DC: National Highway Traffic Safety Administration.
4TIRF: Trends Among Fatally Injured Teen Drivers, 2000-2012
7McKiernan, A., & Fleming, K. (2017) Canadian Youth Perceptions on Cannabis, Ottawa, Ont.: Canadian Centre on Substance Abuse.
8Patton, D., Brown, D., Broszeit, B., & Dhaliwal, J. (2001). Substance use among Manitoba high school students. Addictions Foundation of Manitoba.
9Porath-Waller, A. J., Brown, J. E., Frigon, A. P., & Clark, H. (2013). What Canadian youth think about cannabis. Ottawa. Canadian Centre on Substance Abuse.